Ask Liverpool fans what went wrong in Slot's second season and the answer was rarely abstract. It felt slow. It felt safe. Possession moved without enough incision, attacks stalled before the box, and too many matches had the same uneasy rhythm: Liverpool had the ball, but not the old threat.
The numbers point to the same place. This was not just a finishing slump or a run of near misses. The decline was in the chances themselves - fewer of them, worse ones, and fewer easy routes to goal.
The numbers tell a different story
Expected goals gives us a clean test. If Liverpool were creating the same level of danger but simply failing to finish, xG would stay high while goals lagged behind. If xG itself falls, the problem starts earlier: tempo, progression, shot selection, and chance creation.
| Season | xG / match | Goals / match | Gap |
|---|---|---|---|
| Klopp 2023–24 | 2.49 | 2.26 | −0.23 |
| Slot Y1 2024–25 | 2.45 | 2.26 | −0.19 |
| Slot Y2 2025–26 | 1.77 | 1.66 | −0.11 |
Source: Understat match-level xG. Slot Y2: full 38-match season. Percent changes are rounded from the displayed per-match means.
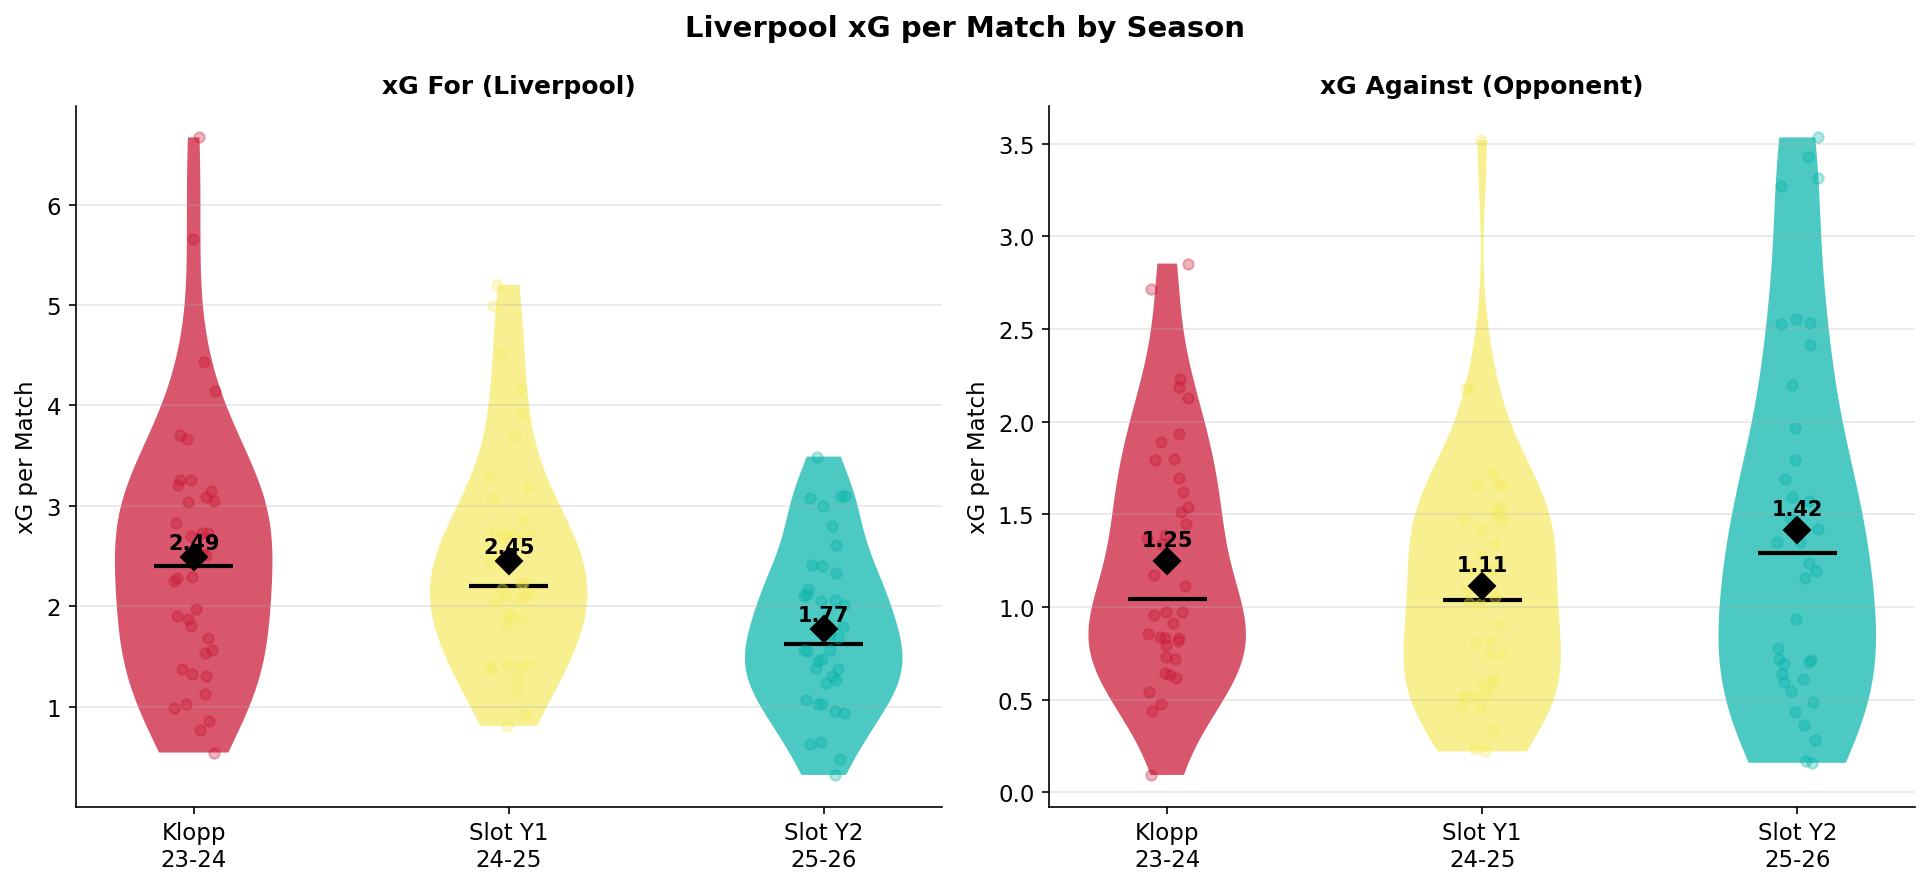
The xG/match column is the headline: 2.49 to 1.77, the steepest single-season fall of the three. That is the statistical version of what supporters were watching: less sustained danger, fewer high-value attacks, and a team that could no longer turn possession into pressure at the same rate. The gap column matters too, because it separates a chance-creation problem from a finishing problem.
The finishing was never the problem
If Liverpool were simply unlucky, the gap would blow out: lots of xG, far fewer goals. It didn't. A bad-luck season would show a much larger negative gap - goals far below xG. Instead the gap held steady. Klopp finished 0.23 below his xG, Slot's first season sat at −0.19, and for the first 30 matches of Y2 the figure was −0.21 - squarely in line with both previous seasons.
Through 30 matches, Liverpool finished their chances almost exactly as they had in the two previous seasons. The drop was upstream - fewer chances, worse ones, and less attacking pressure before the shot.
The full-season gap of −0.11 is flattered by a short late run of overperformance across matches 31–37, then partly corrected on the final day at Brentford, where Liverpool generated 2.99 xG, scored once, and drew 1–1. The late scoring was variance. The xG itself - 1.77 per match, down 29% from Klopp's 2.49 - was the season in miniature.
Both levers broke simultaneously
So where did the chances go? To answer that, the next two tables draw on a separate shot-level data pull. Note: shot volume, xG/shot, and set-piece xG use the original Understat shot-level pull; Y2 covers the first 30 matches in that pull. Match-level xG, goals, opponent xG, and PPG reflect the complete 38-match season throughout.
Slot's first season had a logic to it:
| Season | Shots / match | xG / shot |
|---|---|---|
| Klopp 2023–24 | 20.8 | 0.123 |
| Slot Y1 2024–25 | 17.1 | 0.146 |
| Slot Y2 2025–26 | 15.5 | 0.118 |
Slot's first season took fewer shots but made them count, at 0.146 xG per shot against Klopp's 0.123. Total xG barely moved, goals were identical, and the season ended with a Premier League title. The trade-off - volume for quality - held the output steady.
This season broke that logic. Volume fell again, to 15.5 shots per match - but this time quality didn't compensate. At 0.118 xG per shot, the chances were worse than Klopp's, not better. That is where the complaints about slow, sterile possession show up in the data: fewer attacks ending in shots, and the shots that did arrive were not good enough to offset the lower volume.
Set pieces: a specific tactical fingerprint
Set-piece output also declined:
| Season | Set-piece xG / match |
|---|---|
| Klopp 2023–24 | 0.679 |
| Slot Y1 2024–25 | 0.487 |
| Slot Y2 2025–26 | 0.339 |
Set-piece expected goals halved from the Klopp era to Y2 - roughly a third of a goal per match in expected value, gone. And it did not happen all at once: the drop from Klopp to Slot Y1 was already −28% (while Trent Alexander-Arnold was still at the club), and it continued after his departure (−30% Y1→Y2).
The defence held until it didn't
Slot's defence did provide a cushion in year one. Liverpool conceded an opponent xG of just 1.11 in Y1, the best of the three seasons, which cushioned the attacking efficiency shift. That buffer was gone in Y2.
Opponent xG/match: 1.25 (Klopp) → 1.11 (Slot Y1) → 1.42 (Slot Y2).
Attack and defence regressed simultaneously. The 1.58 PPG - roughly 60 points across a 38-match season, down from 2.16 under Klopp and 2.21 in Y1 - is not a cluster of near misses. It was the predictable arithmetic of creating fewer, worse chances, while allowing more of them at the other end.
What independent data confirms
A second dataset, covering full Premier League seasons from SportsMonks, confirms this:
- Ball Safe (secure possession): −13.9%
- Shots on target: −36.8%
- Goal attempts: −29.5%
- Tackles per match: −27.0% (17.8 → 13.0 per match)
These are not marginal signals. They are not close calls. The press is down, the shots are fewer, secure-possession events are lower, and the quality is worse. The football looked slower and less forceful because the underlying actions that create pressure had declined.
What you watched in 2025–26 - the listless phases, the inability to break teams down, the sense that the old danger had drained away - is documented across three years of data from two sources.
What this does not prove
The data shows what changed, not why. It cannot isolate Slot's tactical choices from squad changes, Trent Alexander-Arnold's departure, injuries, or fixture difficulty; it does not adjust for opponent strength, so a tackle count of 13.0 per match means different things against different opposition; and it makes no claim about next season. What it does show is that the decline appears in attacking xG, shot volume, shot quality, set-piece output, and independent match-stat signals.
You weren't imagining it.